.avif)
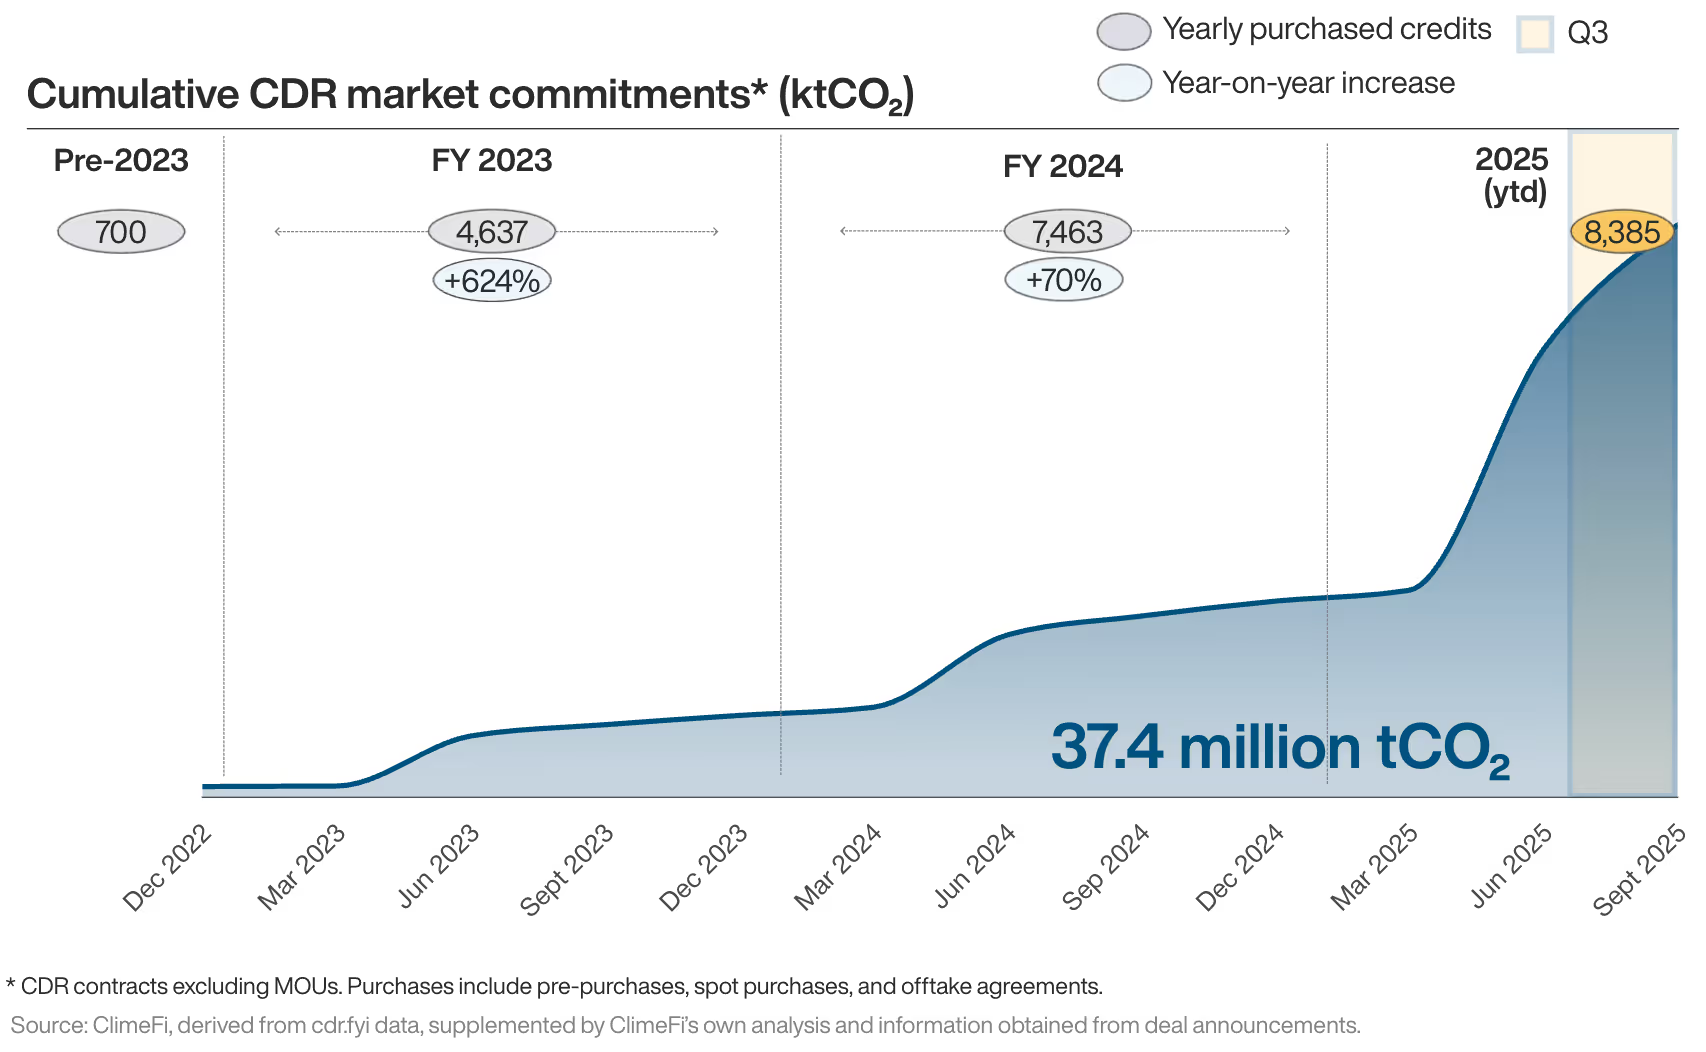
The durable carbon dioxide removal (CDR) market continued its impressive growth trajectory in the third quarter of 2025. Following a record-breaking Q2, the last three months marked the second most active quarter in terms of CDR purchase commitments, highlighting that the rapid growth seen last quarter was not just an anomaly.
In Q3, 8,385 kilotonnes (kt) of new CDR contracts were signed, representing a 584% increase over the same quarter last year. This pushed the total CDR market commitments up to 37.4 million tCO2 (see Figure 1).
Figure 1
Big spending continues, BiCRS leads
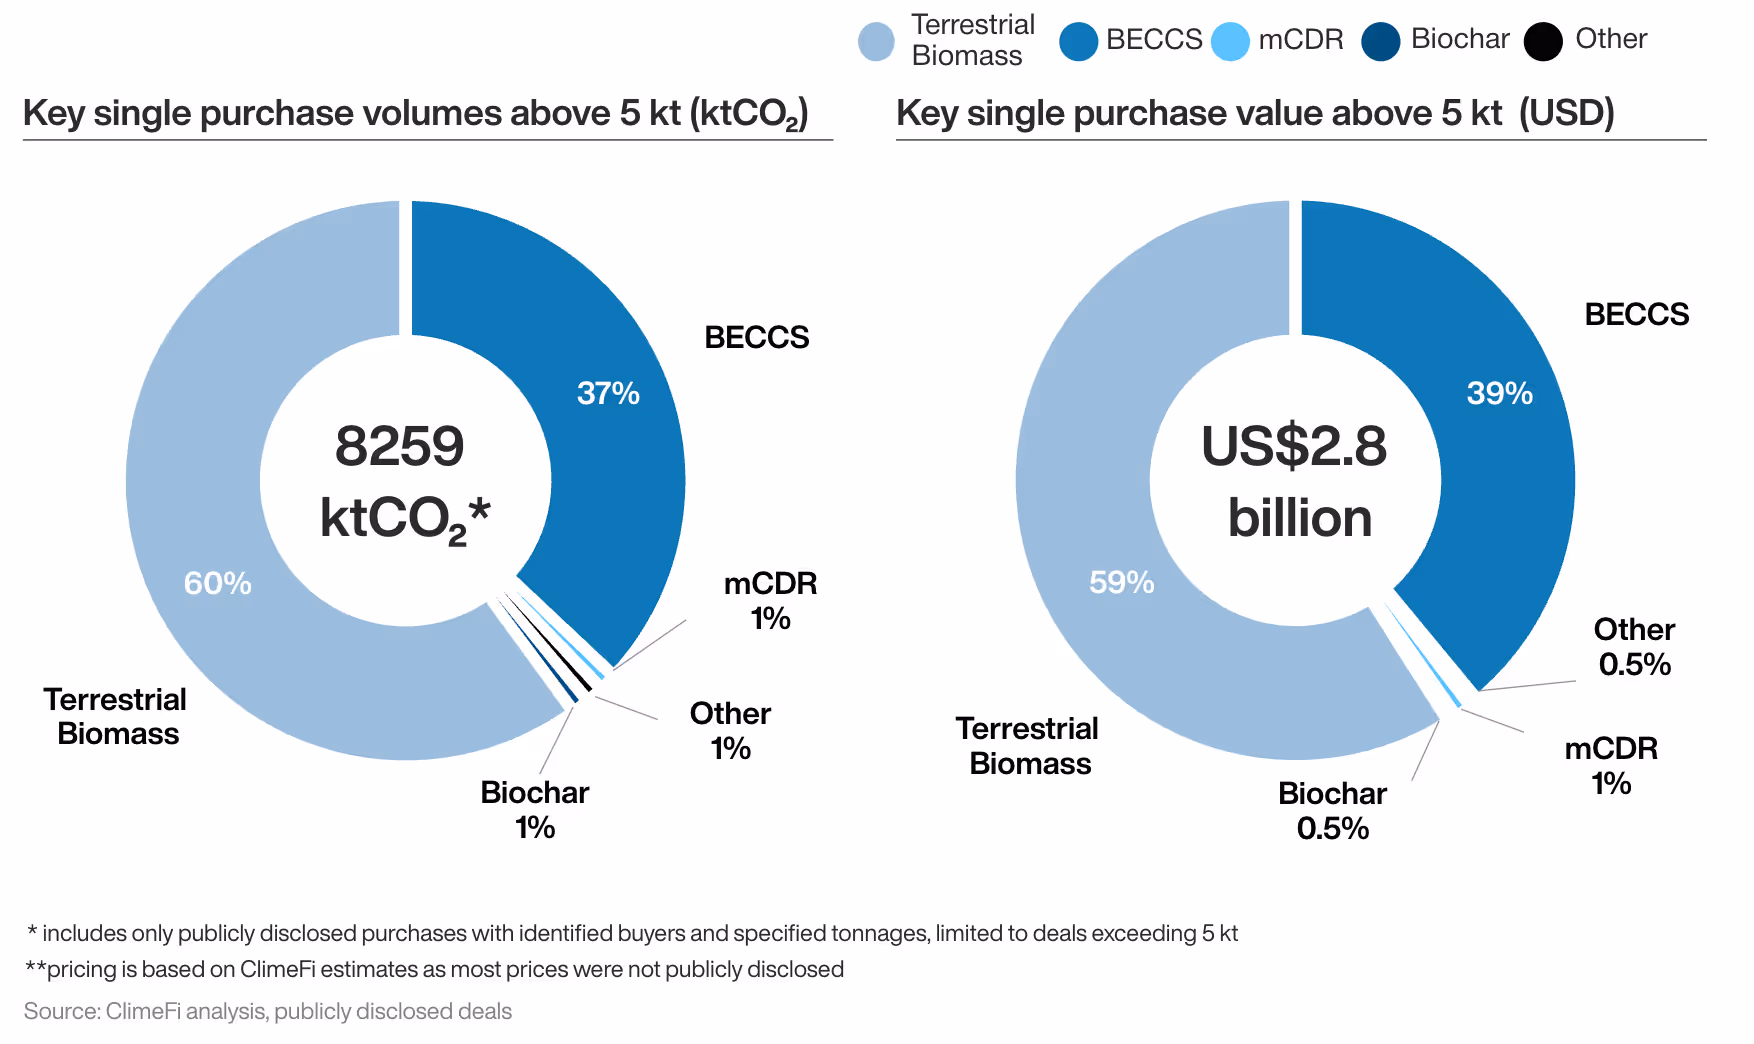
Q3 saw the second highest amount of money spent by corporate CDR buyers in a quarter, up 546% vs Q3 2024. In line with the rest of 2025, BiCRS pathways – primarily Terrestrial Biomass and BECCS – dominated both the volume and the economic value of purchases in Q3 (see Figure 2).
However, a closer look at the market reveals dynamic shifts among other pathways: Marine CDR, for example, has seen a significant increase in market interest in 2025. With 115 kt purchased in Q3, Marine CDR has now registered around 350 kt of commitments this year.
Figure 2
Contracted volume analysis
From the overall projected credit volume 2026-2030, around 20% is already contracted, with 26% in 2026 (see Figure 3).
Figure 3
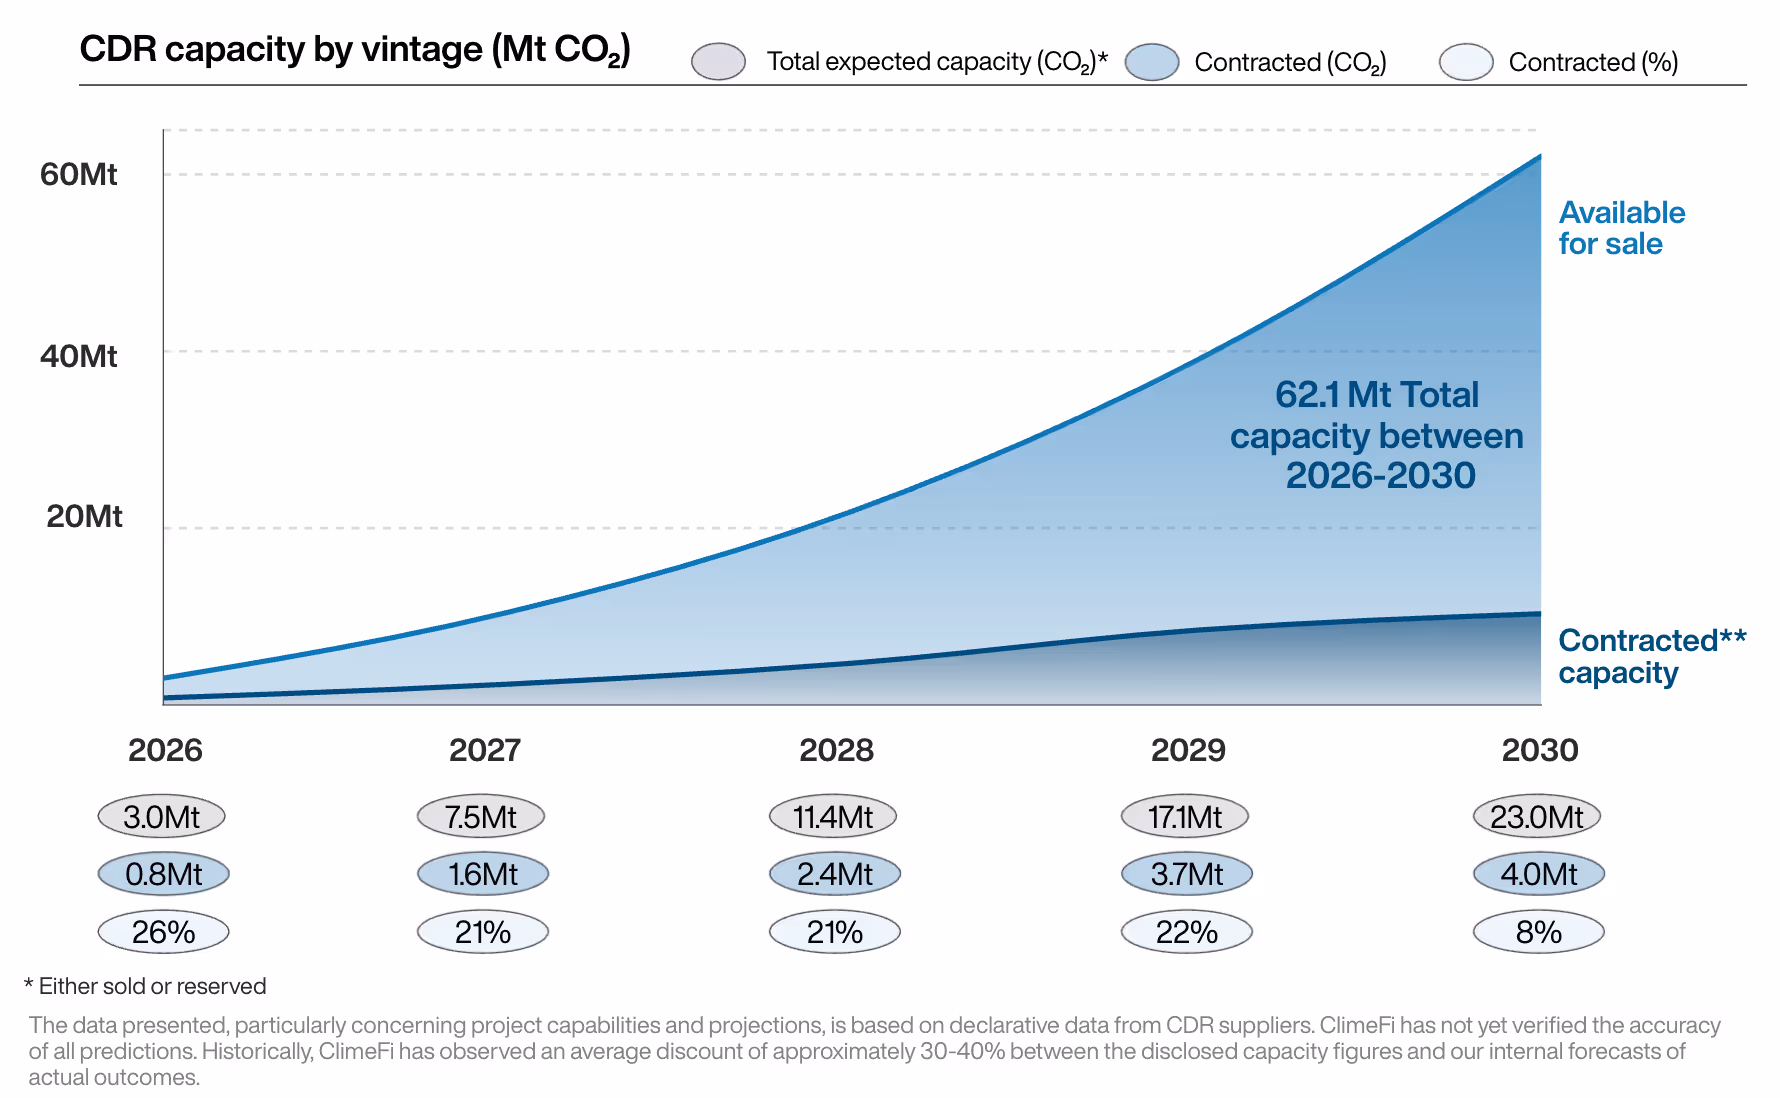
The rapid expansion of capacity is driven initially by biochar, and enhanced weathering (EW) and BECCS in later vintages. Contracted capacity increases over time, partially driven by approaching net-zero years of some corporates.
A significant portion of capacity for EW, Mineralisation, and Bio-Oil is already sold out in 2026 (see Figure 4).
Figure 4
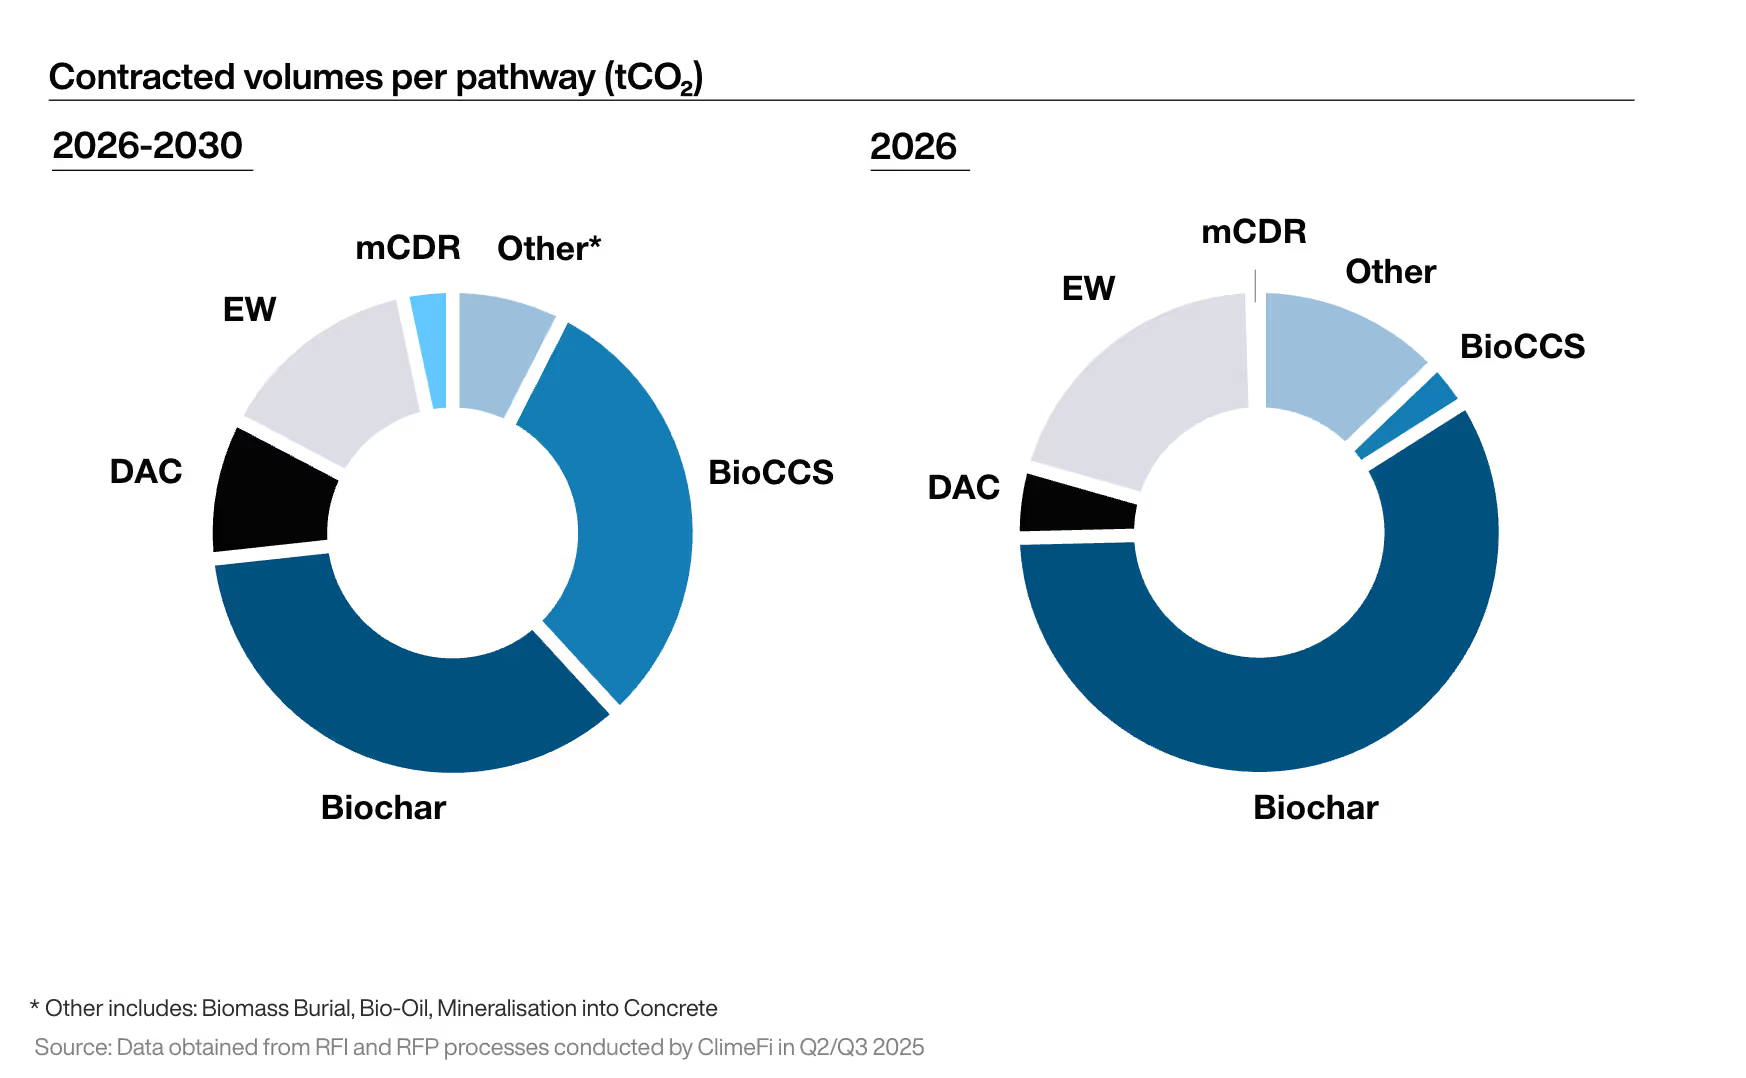
BioCCS leads the way in converting future capacity into long-term offtake agreements. From 2026-2030, Biochar and BioCCS lead in terms of contracted capacity, with EW following closely behind.
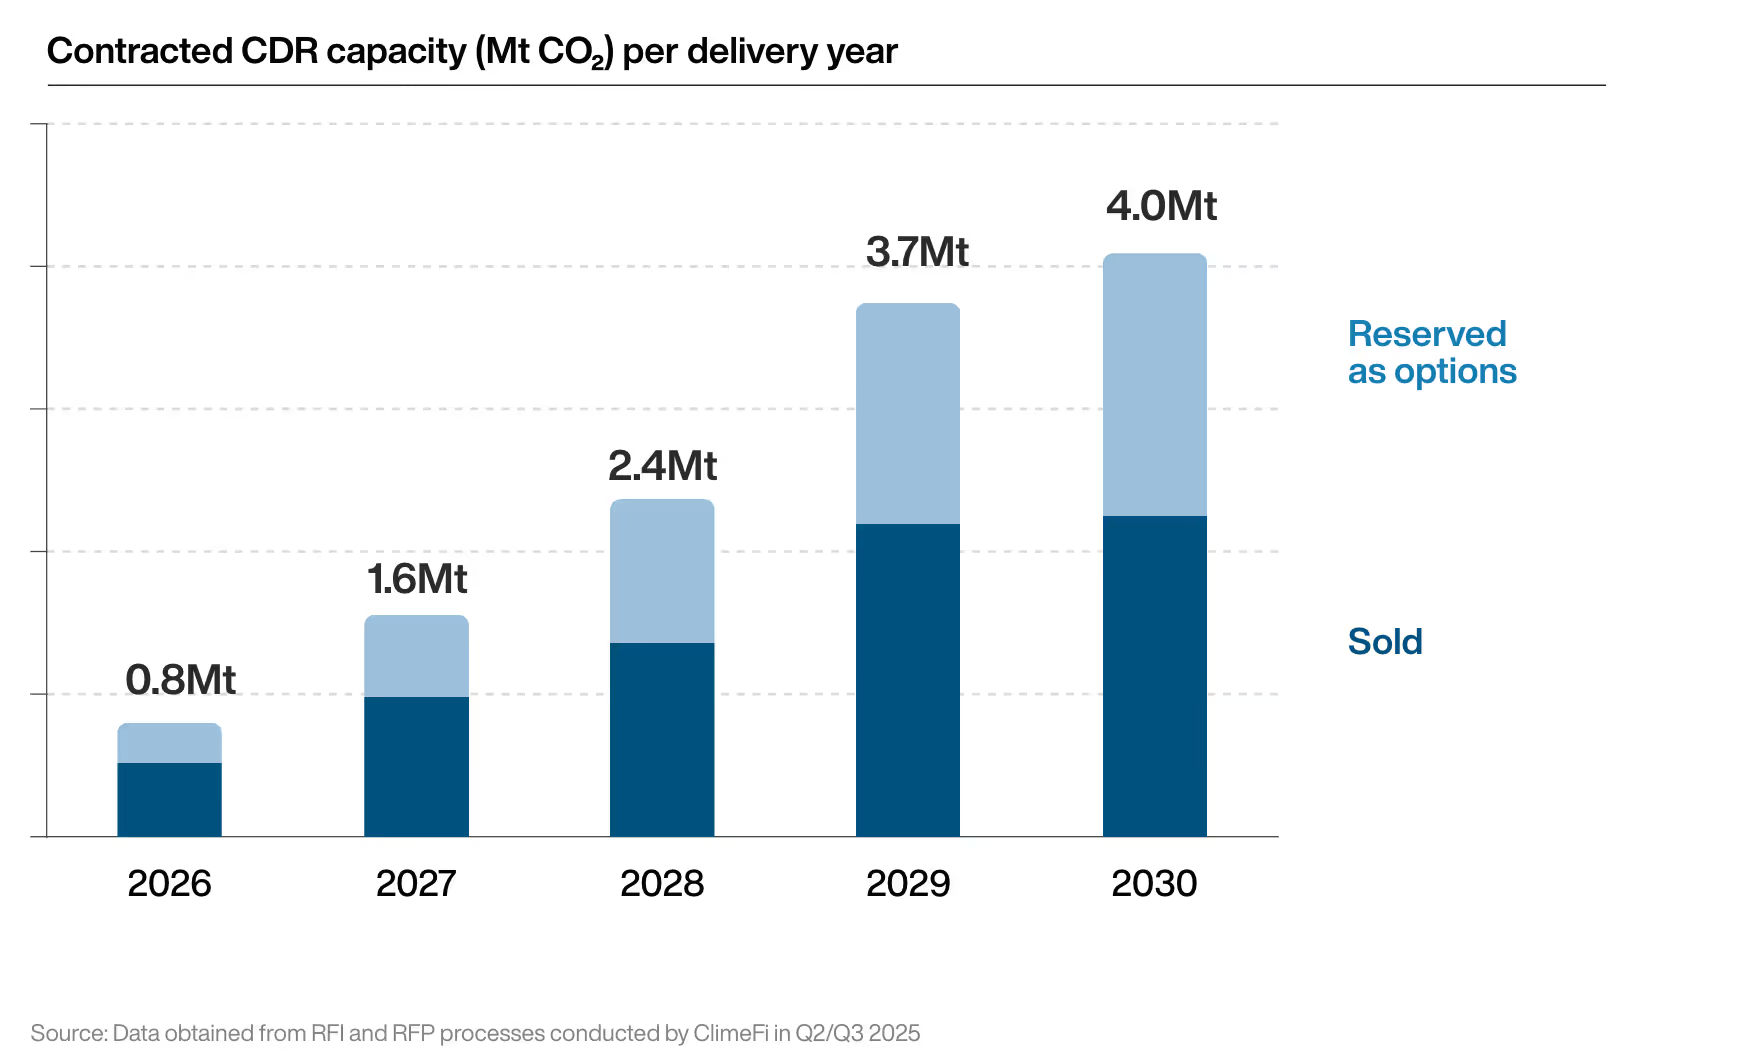
A considerable amount of tonnes committed are only reserved as options (see Figure 5), bringing both opportunities and risks for buyers and suppliers. While options give buyers the flexibility to adjust their portfolio, too much optionality can leave suppliers with uncertainty around their revenue stream, and therefore their capacity to deliver credits on time.
A deliberate mix of both firm offtakes and options is emerging as best practice to keep buyer portfolios flexible while also ensuring supply is sustainable.
Figure 5
Buyers diversify, issuance increases
A hallmark of Q3 was the diversification of demand, a critical sign that the market is moving beyond first-movers. Q3 2025 saw 11 unique buyers purchase CDR – the highest amount in a single quarter.
Key highlights include:
- New corporate leaders. Palo Alto, Barclays, Schneider Electric, Heba, and IMC all purchased CDR for the first time in Q3.
- Japan gains momentum. NYK’s agreement with 1PointFive marked the fourth CDR deal made by a Japanese corporate buyer this year.
- July traction. July proved to be the second biggest month for CDR purchase commitments (after April 2025).
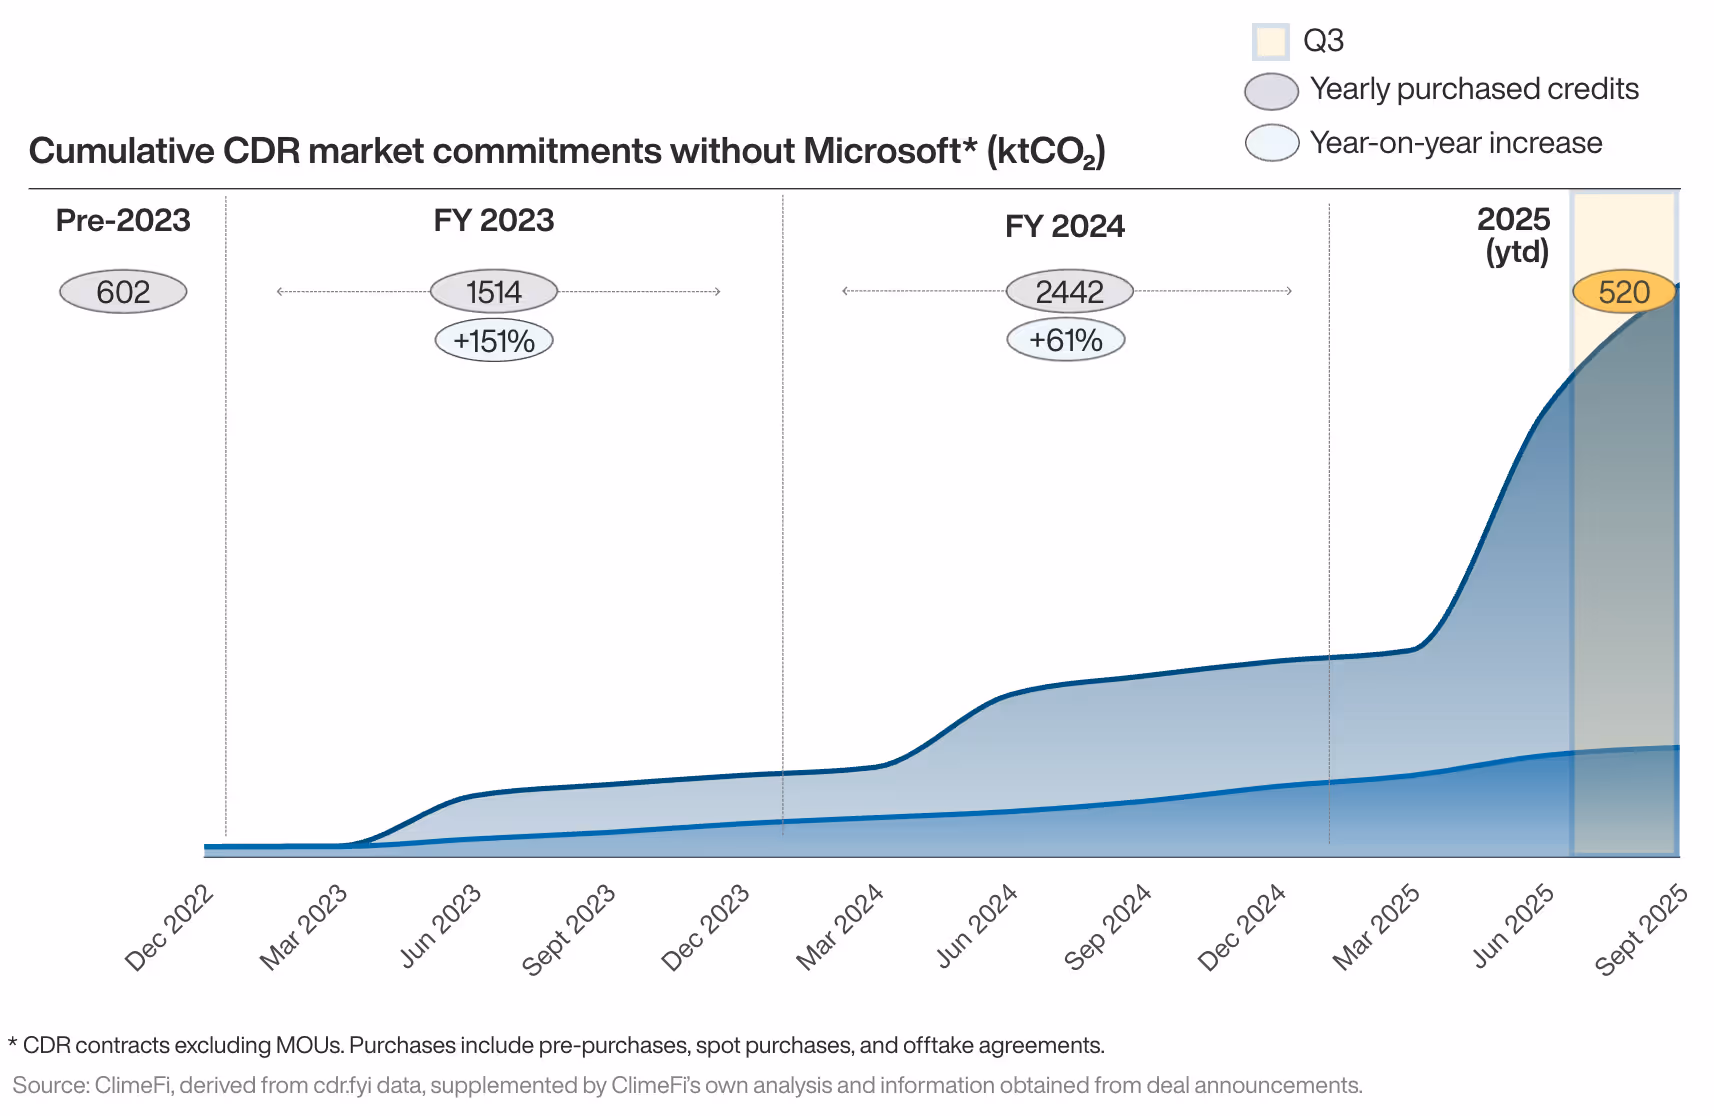
While Microsoft still dominates the market with around 80% of the market share, it is clear that other companies are increasingly starting to follow suit (see Figure 6).
Figure 6
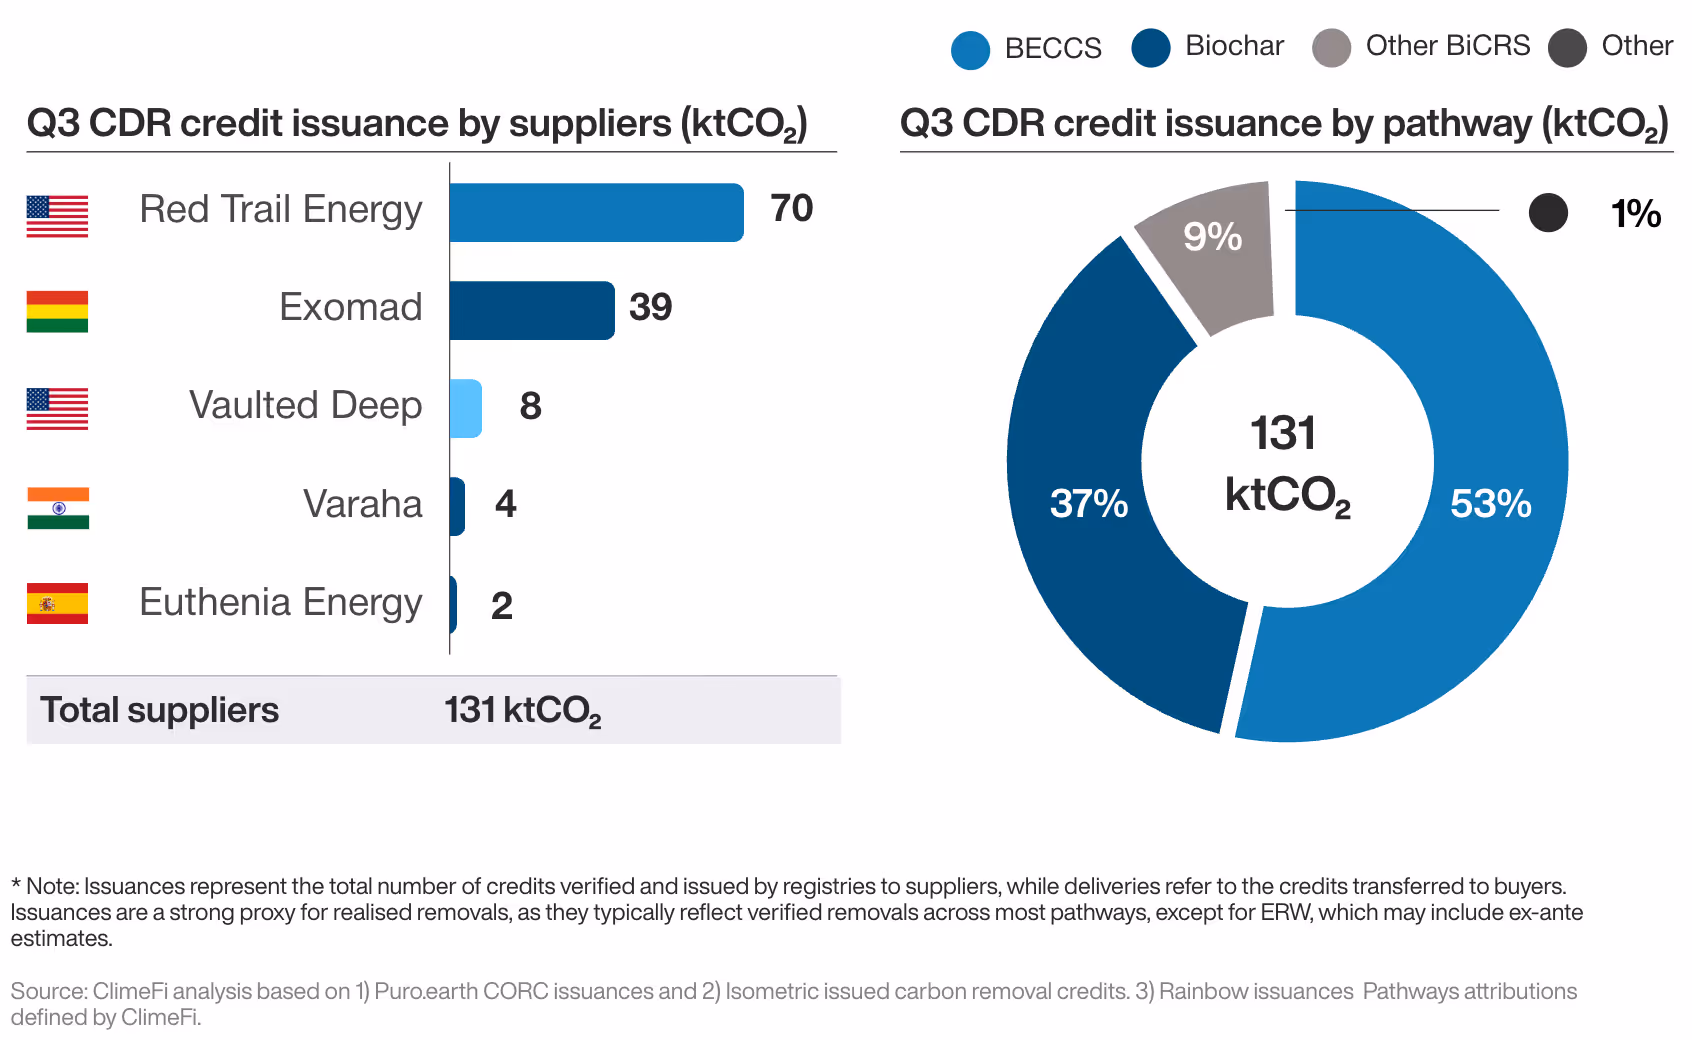
Perfectly complementing this shift in buyer mentality, the supplier ecosystem is also rapidly maturing. A record 19 different suppliers issued credits in Q3, the most ever in a quarter.
BiCRS dominated credit issuance once again with projects based in the United States accounting for 61% of all credits issued in Q3 (see Figure 7). Issuances on the Puro.earth registry hit their highest level in eight months during September.
Figure 7
Policy update
Pushing the carbon removal agenda even further forward, Q3 also saw some key policy developments around the world:
- US. California passed three major bills to support CDR, including the creation of a CDR purchase program that commits US$50 million to credit buying through a competitive grant process.
- Germany. The German government committed almost half a billion euros to help scale the market, including €111m for CDR in 2026 and a substantial €320m between 2027-2033.
- UK. The UK announced plans to integrate greenhouse gas removals (GGRs) into its ETS by the end of 2028, aiming to be operational by Q4 2029.
- South Korea. The Government of South Korea is moving forward with plans to establish a voluntary carbon market exchange in a bid to boost demand for carbon credits and strengthen the country’s GHG reduction framework
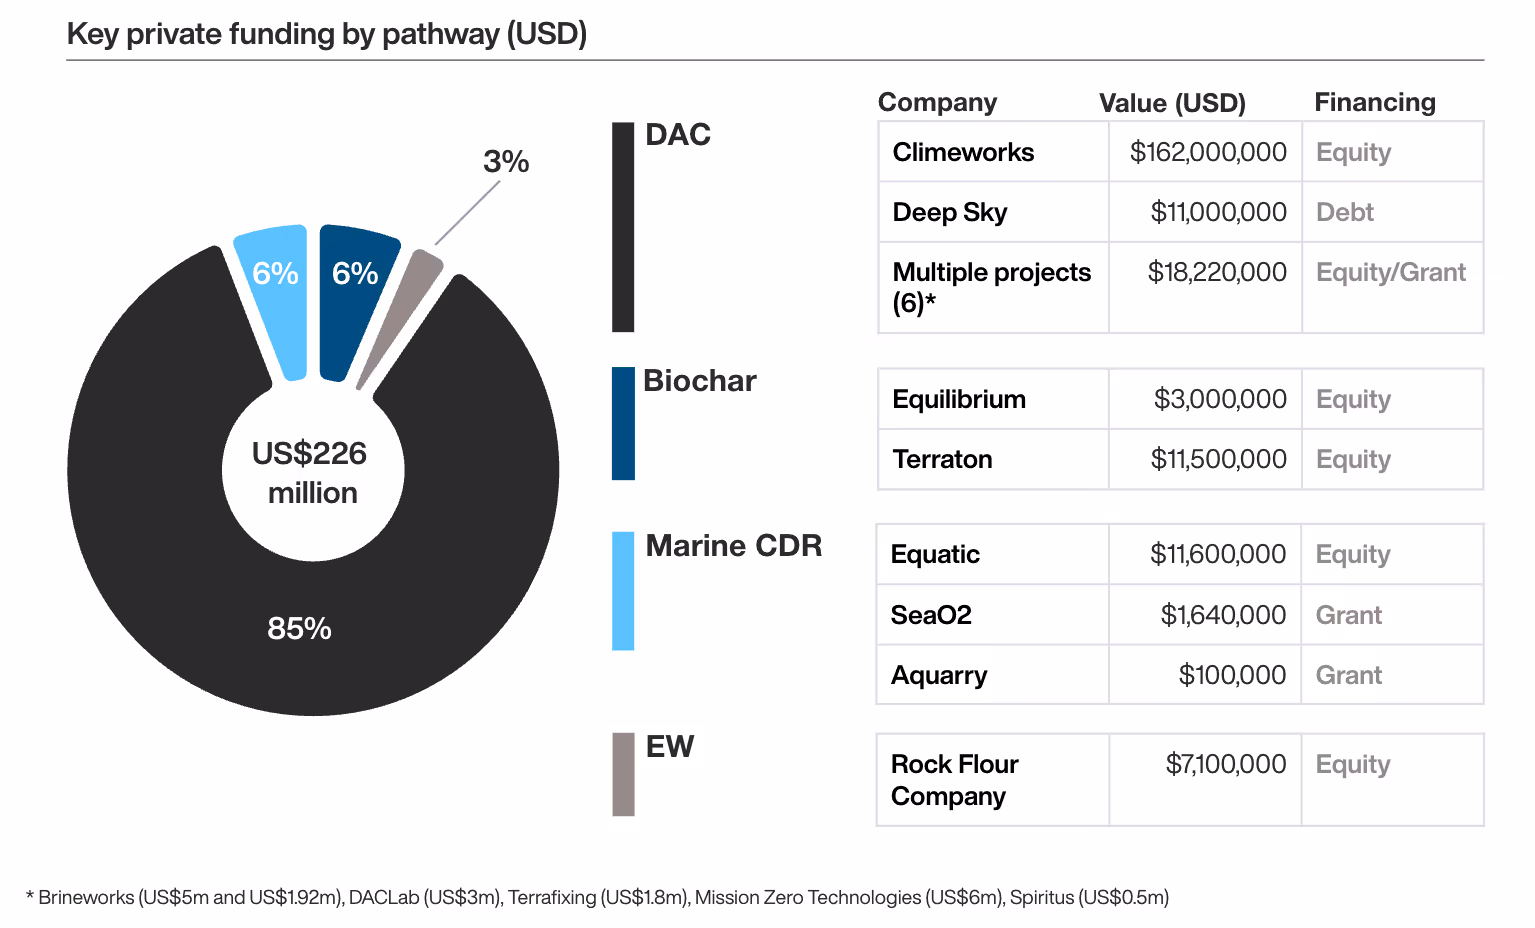
Key private funding
After a slower first half of the year, equity financing rebounded with over US$200 million raised in Q3 (see Figure 8).
Q3 saw the first debt financing for a Direct Air Capture (DAC) project, a clear sign that the pathway is becoming more financially robust and less risky for institutional investors.
Figure 8